Java Chapter 16 - Big O Notation
In comparing algorithms (e.g.
sorts), the Big O Notation can be used to compare their growth rate as the size
of the data set (n) increases. Big O is just one tool to compare
algorithms. Just because two algorithms have the same Big O doesn't mean
that they are exactly equivalent - there are other variables to consider.
Big O is generally listed as time complexity or space complexity.
Big O time complexity typically shows how many iterations (loops) are necessary and is expressed
in terms of the data set size n. It states the worst case scenario.
For example, a for loop would be listed as
O(n)
whereas a nested for loop would be
O(n2).
Big O space complexity shows how much memory the algorithm uses as the data set
size increases. For example, if a sort algorithm creates new dynamic arrays,
then the space complexity will be larger than O(n).
16.1
Big O Time Complexity Examples
| Big O |
Description |
Example(s) |
|
O(1) |
This describes an algorithm that will execute in
the same amount of time regardless of the size of the data input. |
- a series of if statements or a fixed size loop
- hash table |
|
O(n) |
This describes an algorithm the grows linearly
in proportion to the size of the data set (n). |
- a for loop that executes n times
- Searching an array or stack |
|
O(n2) |
This describes an algorithm that grows
proportionally to the square of the size of the data set. A nested for
loop such as the bubble sort has this growth rate. |
- nested for loop
- bubble sort
- selection sort |
|
O(2n) |
Each time a function is called, it invokes two
additional function calls. |
- recursive Fibonacci function |
|
O(log(n)) |
This describes an algorithm that grows
logarithmically to the size of the data set. Note that in programming
this often means a base logarithm: log2(n) |
- binary search tree |
|
O(n log(n)) |
This describes an algorithm where the data set
is split in halves recursively and each part is executed n times. |
- merge sort |
For example, the Bubble Sort can be written as a nested for loop where each loop
executes n times (below).
Therefore, the growth rate is the square of the growth rate of the size of the
data set (n). This is written
O(n2).
// bubble sort
for (int x=0; x<n; x++)
{
for (int y=0; y<n; y++)
{
// compare data[y] & data[y+1]
and swap if needed
}
}
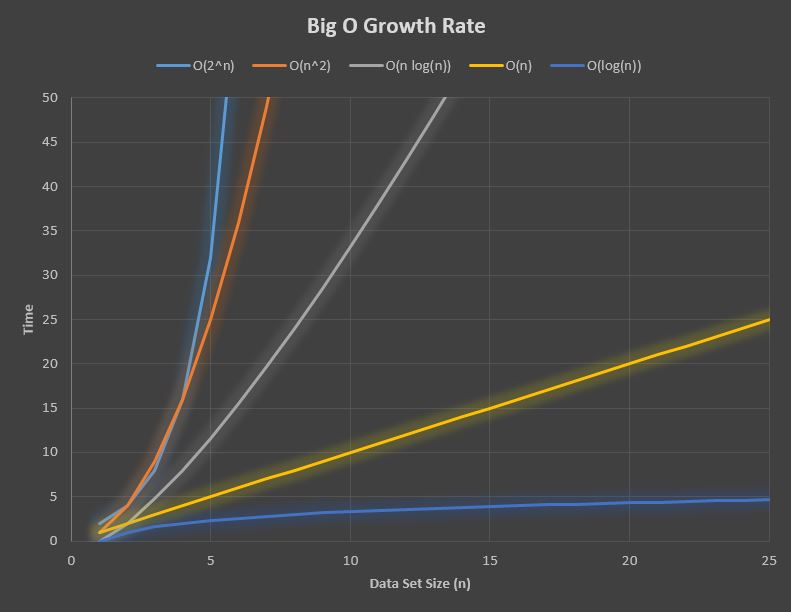
The graph below shows the growth rate for some popular algorithms. The
y-axis is usually expressed as time, but could also be expressed as number of
iterations.
16.2
Algorithms Compared
| Algorithm |
Time Complexity |
Space Complexity |
|
Array Search |
O(n) |
O(n) |
|
Stack Search |
O(n) |
O(n) |
|
Linked List Search |
O(n) |
O(n) |
|
Binary Tree Search |
O(log(n)) |
O(n) |
|
Bubble Sort |
O(n2) |
O(n) |
|
Selection Sort |
O(n2) |
O(n) |
|
Merge Sort |
O(n log(n)) |
O(log(n)) |
|
Radix Sort |
O(nk) |
O(n+k) |
n = dataset
size, k = length of keys